The solar industry has a long history with tax credits and an up-and-down nature that has led to the very fitting nickname, the solar coaster. With its heavily politicized nature, solar (and renewable energy as a whole) seems to always be a point of contention in every election cycle. But the data tells a very different story.
The recent passage of H.R. 1, the “One Big, Beautiful Bill,” marked a drastic and sudden change in solar tax credit policy, as it set the federal solar tax credit to end at the end of 2025. The Inflation Reduction Act of 2022 brought the solar tax credit back up to 30% and extended the credit until 2032, where it would then step down.
This sort of back-and-forth policy has plagued the industry since the modern version of the tax credit was signed into law by President Bush in the Energy Policy Act of 2005. But as we mentioned, the data for the solar industry tells a very different story. While the general sentiment of those working in the industry has a “solar-coaster”, the data regarding annual installation volume and jobs shows an industry almost continually on the rise.
With that in mind, this piece will walk through the major solar timeline of the last 20 years and shows how, despite changing policy and politicization, solar continued to thrive. And through this historical look, we’ll see why the federal solar tax credit’s expiration likely won’t spell doom for the industry.
Table of Contents
1978 – The Energy Tax Act
We briefly touched on the history of solar tax credits in a previous article, but to give some context as to how long they have been a part of the energy mixture, it’s important to look back at the beginning.
The Energy Tax Act of 1978 was signed by President Carter and created a credit for renewable energy systems. Solar PV was included in this credit, but due to the technology being in its infancy, the credit was largely used for solar thermal systems.
This original tax credit covered 30% of the first $2,000 in expenses, and 20% of the next $8,000. The credit was later bumped up to 40%, before expiring under President Reagan. President Reagan’s administration was notably anti-renewable, with the famous story being that he removed the solar thermal panels President Carter had installed on the White House roof.
The Energy Policy Act of 2005
2005 was the beginning of the modern solar tax credit as we know it today. During the early years of the Second Gulf War, dependence on oil from the Middle East was a hot topic. With that in mind, President Bush signed the Energy Policy Act to, in part, reduce our dependence on foreign oil and build up the US energy economy.
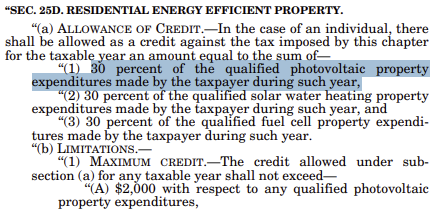
This version of the credit gave homeowners a 30% credit up to $2,000 for expenditures made for qualified photovoltaic property. The credit was originally set to expire at the end of 2007, but it was later extended to the end of 2008.

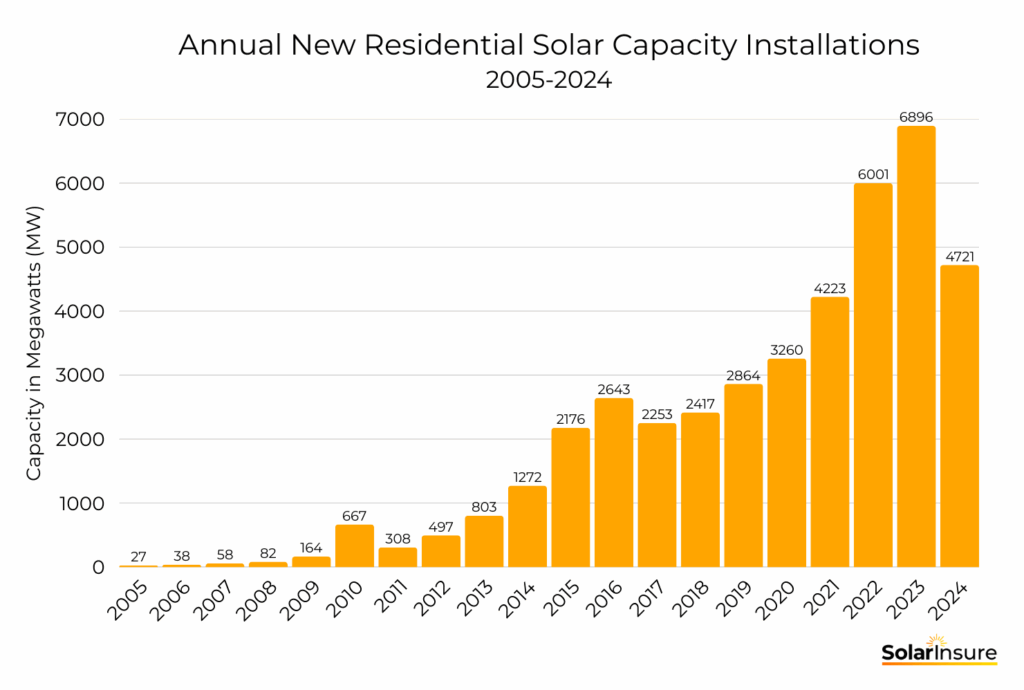
Data from SEIA and Statista show that over this period, the US residential sector installed:
- 27 MW (megawatts) in 2005
- 38 MW in 2006
- 58 MW in 2007
- 82 MW in 2008
The industry was averaging a 44.9% annual growth rate and was about to take a major jump.
A New Administration, Renewable Policy, and Economic Crisis – 2008
In November of 2008, President Obama won the election, and his administration’s renewable energy policy focused on the expansion of wind and solar to further reduce dependence on fossil fuels. 2008 also marked one of the worst economic crises in recent memory, the Great Recession. President Bush signed the Emergency Economic Stabilization Act of 2008, which included bank bailouts.
One of the items also included in that bill was the extension of the Section 25D solar tax credit, pushing the expiration date to the end of 2016. The bill also removed the $2,000 limit, allowing homeowners to benefit even more.
This expansion of benefits, along with the new Obama Administration’s focus on renewable development, led to significant increases in residential solar installations:
- 164 MW in 2009, 100% increase year over year
- 667 MW in 2010
- 308 MW in 2011
- 497 MW in 2012
- 803 MW in 2013
- 1,272 MW in 2014
- 2,176 MW in 2015
2011 saw a dip in growth due in part to anti-dumping tariffs that were imposed on Chinese solar manufacturers due to complaints that they were filling the US market with equipment well below “fair value”. As we’ll explore later in the timeline, this is not the only time US solar installs have dropped off due to tariffs. 2011 also saw the Solyndra scandal affecting the solar market.
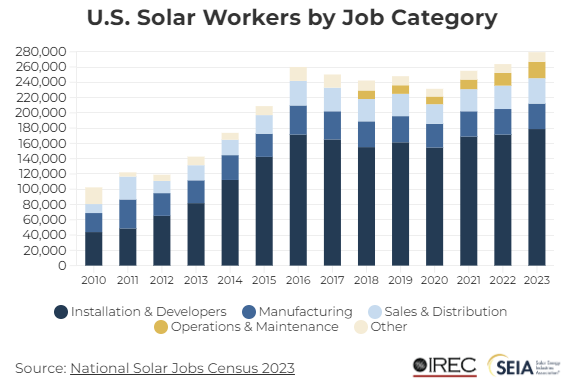
After 2011, the residential market saw an average of 63.1% annual growth. In 2010, the US solar market employed roughly 100,000 workers in all sectors, and by 2015, that number had increased to over 200,000.
A Phase-Out in Sight – 2016
A 2016 consolidated appropriations bill refunded the government for the remainder of fiscal year 2016 and set up an official phase-down schedule for the solar tax credit. Under the step-down plan, tax credits were extended to 2020, at which point the value began to decrease. The plan was:
- 30% for projects installed before 2020
- 26% for projects installed in 2020
- 22% for projects installed in 2021
- 0% starting January 1st, 2022
For the first time, there was a runway established for the industry to slowly move away from the tax credit. Previous administrations had continually chosen to extend renewable tax incentives, but the incoming Trump administration in 2016 wanted to move the focus away from renewables.
During the next few years, solar’s growth rate would start to slow compared to the previous 4-5 years. Installations amounted to:
- 2,643 MW in 2016
- 2,253 MW in 2017
New Solar Tariffs – 2018
To slow the import of foreign-made solar equipment, President Trump added tariffs to solar cells and panels using Section 201 of the US Trade Act of 1974. The tariffs began in February of 2018 at 30% and decreased by 5% per year for the next four years.
For much of its history, solar pricing has continually decreased. But thanks to the new tariffs, prices remained flat and even increased in some cases. While the idea of tariffs to spur on US manufacturing was good in theory, because the tariffs decreased after four years, many manufacturers decided to simply wait out the tariffs rather than open domestic manufacturing.
In early 2020, the US International Trade Commission published a study investigating the impact of the 2018 solar tariffs and found that imports of solar modules actually increased between 2018 and 2019, while domestic cell production decreased over that same time. We’ve previously published a study looking at the impact of these tariffs, and new tariffs; you can read here: https://www.solarinsure.com/what-effect-will-new-tariffs-have-on-solar
However, even with the impact of tariffs on the solar market, the residential sector continued to add volume. During this time, the installed volume was:
- 2,417 MW in 2018
- 2,864 MW in 2019
The Solar Foundation’s National Solar Jobs Census, however, published a study showing a 3.2% decrease in jobs year over year.
COVID and The First Step-Down – 2020
Leading up to 2020, the industry was bracing for a downswing on the solar coaster. The consensus was that the decrease in the federal solar tax credit value would lead many homeowners to rush to install in 2019, but then slow drastically in 2020. And that was before the COVID pandemic.
As someone selling solar during this time, the impact of the COVID pandemic was that many homeowners decided to hold off on major purchases because life felt so unstable. On the other hand, many homeowners wanted to purchase solar systems so as not to miss out on potential tax credits.
Up until 2020, the credit had always been extended. This was the first time the credit had changed since 2005, so many homeowners didn’t want to miss out on the opportunity. During 2020, the tax credit was extended through a government funding bill. This bill maintained the credit at 26% through 2022, then decreased to 22% and 0% in subsequent years.
Despite the fears, through the COVID years, annual install volumes continued to climb:
- 3,260 MW in 2020
- 4,223 MW in 2021
- 6,001 MW in 2022
Jobs in solar energy were down in 2020, but many of the job losses can be attributed to the pandemic. In 2021 and 2022, the solar industry experienced significant growth, with jobs increasing from approximately 230,000 in 2020 to over 260,000 in 2022.
The Inflation Reduction Act – 2022
After a few rough pandemic years, the solar industry had continued to grow, but there was a concern about the looming tax credit expiration. In 2022, President Biden signed the Inflation Reduction Act (IRA), which restored the tax credit value to 30% and extended it through 2032. At that point, the step down would begin again, finally expiring in 2035.
The IRA’s passage gave solar more room to operate, leading to capacity additions of 6,896 MW between 2022 and 2023.
2024, however, would mark the first annual capacity decrease since 2017. Only 4,742 MW were installed in 2024. Largely, this is attributed to NEM 3.0 passing in California, which gutted net metering policies for homeowners. The California solar market, which accounts for a majority of the US solar market, took a huge hit. NEM 3.0 has brought about a boom in the solar and storage market. In 2023, 12% of new residential solar capacity was paired with storage, and in 2024, that number rose to 28%.
Solar jobs continued to rise, though, reaching over 280,000 in 2023.
Tariffs and H.R. 1 – 2025
This brings us to the present day, where new tariffs have been instituted on most countries around the world, and H.R. 1 repealed the solar tax credit extension in the IRA. As it stands now, any owned project installed after December 31st, 2025 is no longer eligible to claim the solar tax credit. Leased, PPA, and commercial systems have a slightly longer runway.
We did a full breakdown on the changes in the Big, Beautiful Bill that can be found here: https://www.solarinsure.com/final-changes-to-solar-tax-credit-from-h-r-1
Why Solar Isn’t Doomed
Throughout our trip on the solar coaster timeline, one fact remains constant in the data: the volume of installations and job growth continues to rise. Yes, there were some bumps in the road, but the industry always continued to grow because of one simple fact: solar makes sense.
Here’s the growth information in graphical form, from Statisa and SEIA:


As the title of the article suggests, the numbers here show why the loss of the solar tax credit won’t mean doom for residential solar. Even through all the ups and downs of the solar coaster over the last 20 years, solar has continued to surge. Even in the years with a decreasing tax credit, looming expiration, gutted NEM policies, and global pandemics, solar capacities continued to rise.
In a post-ITC industry, we may find that the next year or two could look like 2011, 2017, or 2024. As history has shown, the industry continually finds ways to innovate, adapt, and thrive.
Losing the solar tax credit will certainly put strain on the industry, but it will also force solar manufacturers, installers, and finance companies to adjust to the market.
To be successful in the new market, solar installers need to:
- Diversify – add in new forms of revenue to strengthen their business position and be able to offer additional value-added services to their customers
- Embrace New Financing – Solar financing will likely change with a move away from dealer-fee heavy loans to higher interest options, or local options like credit unions.
- Focus on Operational Excellence – Inconsistent success is as bad as failure. For companies to be successful, focus on doing both the big and little things right to provide customers with exceptional value. Remember, at the end of the day, solar still provides unmatched value to customers and their homes.
Even without the tax credit, solar projects remain a low-cost form of energy and provide energy resilience. Payback periods without a tax credit shift backwards only 3-5 years, so homeowners can still find exceptional value in solar.


